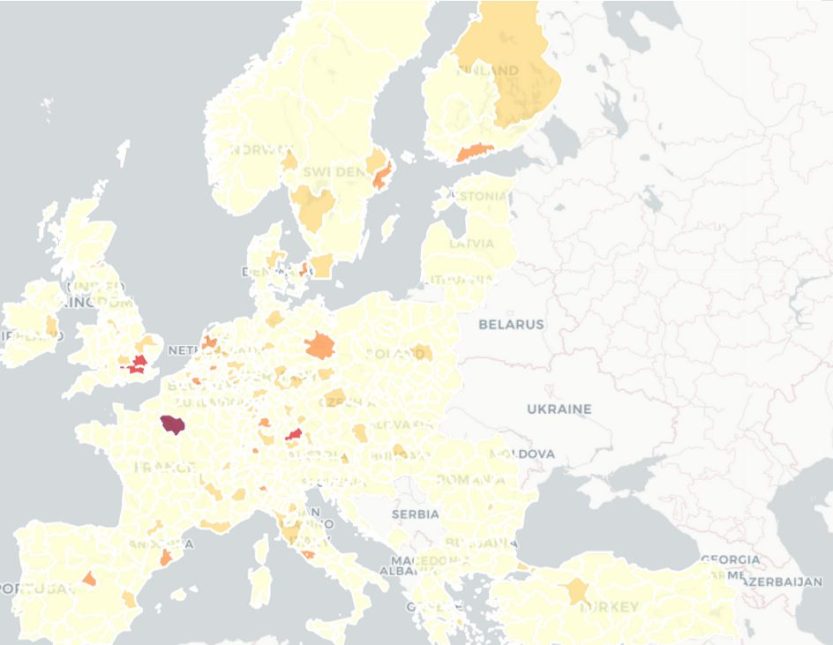
The KNOWMAK data stories are intended to demonstrate the features and opportunities of the KNOWMAK tool by means of concrete applications to interesting research and policy questions. The first data story presents a composite indicator combining scientific publications, European projects and patents to investigate the overall distribution of knowledge production across Europe. KNOWMAK distinguishes between production volume and intensity: Production volume is the aggregate (over all topics in KET and SGC) of the raw number of publications, patents and projects, while production intensity normalizes the production volume by population.
The results are illustrated with the analytical possibilities available in the tool showing that knowledge production volume is highly concentrated in large metropolitan regions, with Paris (in France), London (in the UK) and Munich (in Germany) ranking in the first three positions. The distribution appears highly skewed, with the first 10 regions (mostly large metropolitan regions with a population higher than 2M inhabitants) that account for more than 20% together. However, among these regions, only Munich ranks in the top 10 regions as to intensity. Paris and London, which are by far the most important regions in terms of volume, rank #45 and #127, respectively, in terms of knowledge production intensity. Their position is therefore largely accounted for by their sheer demographic and economic size. On the other hand, medium-size metropolitan areas like Eindhoven (in the Netherlands), Uppsala (in Sweden) and Heidelberg (in Germany) rank in the first three positions in terms of production intensity, while still having rather large volumes of knowledge production. This emphasises the important role of such medium-size regions that is likely to emerge even more clearly when analysing specific research domains.
More details and Steps to reproduce this data story can be found under “GO TO DATASTORIES” on www.knowmak.eu.


